Once a growth target is set, most projects start by raising the media budget. Campaigns go live, Google Ads, Meta and programmatic start running, and traffic climbs as planned. What rarely gets checked along the way is whether the shop can actually turn all that paid traffic into revenue.
That is exactly where conversion rate optimisation (CRO) comes in. In this article we show how much even a small improvement in conversion rate achieves, why the topic gets lost in so many e-commerce projects and which levers pay off first. Our real-world example is a project we delivered with the Swiss watchmaker Grovana.
What are 0.2 percentage points of conversion rate worth?
Far more than the small number suggests. Let us run the numbers for a realistic Swiss shop: 40,000 sessions a month, an average order value of CHF 220 and a conversion rate of 1.80 per cent.
| Metric | Before | After optimisation |
|---|---|---|
| Conversion rate | 1.80% | 2.00% |
| Orders per month | 720 | 800 |
| Revenue per month | CHF 158,400 | CHF 176,000 |
| Revenue per year | CHF 1,900,800 | CHF 2,112,000 |
| Difference per year | + CHF 211,200 |
Those 0.2 percentage points add up to more than CHF 200,000 in extra annual revenue, without a single extra franc going into media. To reach the same figure through additional traffic, the shop would need 4,444 more sessions a month, around 53,000 a year, and it would have to buy them again every single month.
This is the crucial difference that almost always gets lost in budget discussions:
- Traffic is a subscription: The effect ends the moment the budget stops.
- Conversion optimisation keeps working: You pay for the improvement once, and it keeps delivering with no running costs.
- The impact spans every channel: A better conversion rate improves the return on SEA, social, newsletters and organic and direct traffic all at once. In other words, the same media budget delivers 11 per cent more revenue.
Why the problem is so persistent
A poorly converting shop rarely looks broken. It loads cleanly, the products are well maintained and the navigation works. That is precisely what makes the diagnosis hard, because a technically flawless shop is so often mistaken for one that sells well.
The Baymard Institute shows how big the gap really is. In a meta-analysis of 50 individual studies, it puts the average cart abandonment rate at 70.22 per cent. Seven out of ten filled baskets never reach the payment stage.
The reasons are more revealing than the rate itself. Baymard surveyed users who had abandoned the checkout and filtered out those who were only browsing anyway.
None of these five reasons is a traffic problem. All five arise in the shop, and all five can be fixed.
Where does an average shop stand?
By international standards, Switzerland converts well, but not exceptionally. According to Statista, 1.3 per cent of all e-commerce visits worldwide led to a purchase in the second quarter of 2026. For Switzerland, Statista reports 2.4 per cent, the highest figure of any country it lists.
Based on real European transactions, IRP Commerce measured 2.03 per cent for the overall market in June 2026 and 1.70 per cent for fashion and accessories. There is no reliable benchmark specifically for watches and jewellery, so we use fashion and accessories as the closest comparison.
A second figure from the same source is at least as relevant: acquisition costs have risen to 9.34 per cent of revenue, up 17.78 per cent on the previous year. Buying growth is getting structurally more expensive, and that is exactly what tips the calculation in favour of optimisation.
Then there is a finding from Contentsquare’s Digital Experience Benchmark 2026, which is based on 99 billion sessions. Desktop converts 74 per cent better than mobile, while mobile accounts for 69.9 per cent of traffic. So most of the traffic you pay for lands on the weaker experience.
Grovana.ch: from one to three
Swiss watchmaker Grovana has been making “Swiss Made” timepieces in Tenniken since 1924. In 2024, its online shop already had clear navigation, plenty of filter options and product pages with attractive images. Even so, the conversion rate stayed well below expectations.

Instead of buying more traffic, we started by analysing the user experience. Heatmaps and click maps from Microsoft Clarity revealed opportunities that never show up in any report: searches with no results, dead links and a lack of orientation at category level.
The measures themselves were deliberately unspectacular:
- Orientation at category level: Labels such as “Bestseller” or “Engravable” on the products help visitors choose faster.
- Better product presentation: The zoom was enlarged considerably and availability is now shown directly on the product page.
- A clearer checkout: Stronger contrast in the design, with popular payment options highlighted.
- New services: Stylish gift wrapping and watch engraving were added at the end of 2025 to meet demand from gift buyers.


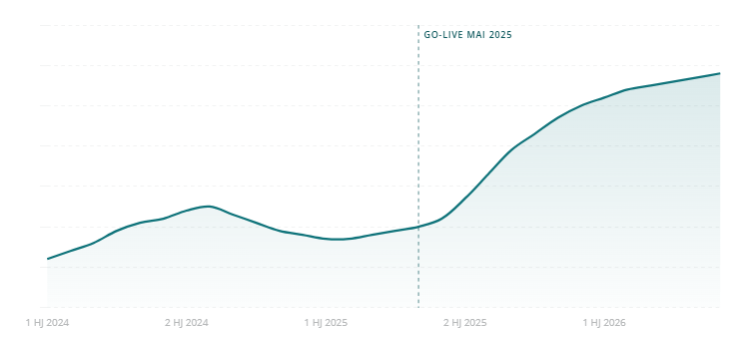
The first changes went live in May 2025. Within a few weeks the conversion rate had doubled, and further refinements lifted it by another 50 per cent in 2026. The bottom line is roughly three times the conversion rate of the starting point. To achieve the same revenue effect through media, Grovana would have had to triple its traffic permanently.
“Adisfaction-Annex spotted the many conversion opportunities in our online shop straight away and turned them into a clear plan. We were pleasantly surprised by how strongly the optimisations paid off, and it motivates us to keep developing the online shop.”
Christopher Bitterli, Managing Director, Grovana Uhrenfabrik AG
You can find the full story with every measure in our case study on conversion optimisation for Grovana.
The five most effective levers in conversion optimisation
- 1Checkout and cost transparencyThe biggest single lever. Baymard estimates that fixing documented checkout UX issues alone lifts conversions by 35 per cent on average, based on 344 of the highest-grossing US and EU shops and more than 4,400 test sessions. Show shipping costs early, allow guest checkout and cut the number of form steps.
- 2Load timeThe study “Milliseconds Make Millions”, carried out by Deloitte for Google, examined 37 European and US brand websites across 30 million sessions. In retail, improving load time by 0.1 seconds raised the conversion rate by 8.4 per cent and average order value by 9.2 per cent. In the luxury segment, the progression from product page to basket even rose by 40.1 per cent.
- 3The mobile experienceMobile carries most of the traffic and, at the same time, the weaker conversion rate. Treat mobile as a shrunken desktop site and you waste most of the audience you have paid for.
- 4Orientation and trustAvailability, return conditions, payment options and product details in sufficient resolution are not cosmetic design touches. They answer the questions that would otherwise make people leave.
- 5Behavioural data, not opinionsHeatmaps, click maps, session recordings and properly run A/B tests show what users actually do. In our experience, the biggest opportunities lie exactly where nobody in the company suspected a problem.
How to spot a CRO problem
- Your conversion rate is below the industry benchmark and nobody on the team can explain why.
- Traffic is growing and revenue grows with it, but ROAS stays flat or falls.
- There is no structured testing, just a relaunch every two years.
- Nobody has touched the checkout since the shop launched.
- Mobile and desktop are not reported separately.
If three or more of these apply, your next growth step probably isn’t in the media plan.
Common mistakes in implementation
Roll out five measures at once and you won’t know afterwards which one worked and which may have done harm. Drawing conclusions too early is just as problematic: without a large enough sample and enough run time, a test result is pure chance, which is why seven to fourteen days is considered the minimum.
A third mistake concerns expectations. CRO is not a one-off project, and Grovana is a textbook example, because the second growth spurt only came a year after the first. Finally, look beyond the conversion rate to order value as well. A rising conversion rate with a shrinking basket is no success. Here, revenue per session is the more honest metric.
Conclusion: you have already paid for the traffic
The reflex to solve growth with more traffic is understandable, because media budgets can be raised quickly and a campaign can be live within days. But it is the more expensive answer, especially as acquisition costs keep rising.
For most small and mid-sized e-commerce shops, the next growth step therefore lies not in buying more traffic but in optimising the existing customer journey. The traffic is already there, and it has already been paid for. The real question is how much of it slips away unused.
Frequently asked questions about conversion optimisation
What does a 0.2 percentage point increase in conversion rate deliver?
From a starting conversion rate of 1.8 per cent, an increase of 0.2 percentage points equals a relative revenue increase of 11.1 per cent. With 40,000 sessions a month and an order value of CHF 220, that is around CHF 211,000 in additional annual revenue without any extra media budget.
What is a good conversion rate for an online shop?
According to Statista, the global average in the second quarter of 2026 was 1.3 per cent, and Statista reports 2.4 per cent for Switzerland. IRP Commerce measures 2.03 per cent for the overall European market and 1.70 per cent for fashion and accessories. It always pays to compare by industry and device.
Is conversion optimisation worthwhile for smaller shops too?
Yes, often disproportionately so. Because CRO improves the performance of every channel at once, the relative effect is especially large when the media budget is limited. And the measures with the greatest impact, such as checkout, cost transparency and load time, are rarely the most expensive.
How long does it take for conversion optimisation to work?
The first effects often show within a few weeks of going live. At Grovana, the conversion rate doubled a few weeks after the first UX changes. Lasting gains then come from continuous refinement.
Is conversion optimisation the same as a relaunch?
No. A relaunch changes many things at once and makes the impact of individual measures impossible to measure. CRO works in small, verifiable steps based on behavioural data.
How much revenue is hiding in your existing traffic?
We analyse your shop’s customer journey using behavioural data, prioritise the opportunities by impact and support the implementation all the way to measurement.
Sources